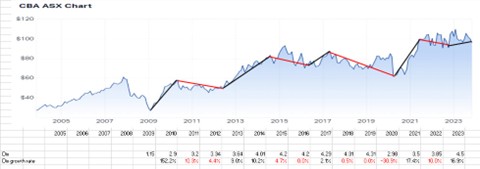
Correlation between dividends and price growth
Why should we look at dividend growth rates?
Companies that manage year-after-year an increase in their profits will attract shareholders by increasing the dividends they distributed annually. Thus, if a company continuously increases the dividend payouts for many years, it must be considered a well-managed company.
There is a strong correlation between companies that achieved the highest annual average dividend growth rate and those that achieved the highest average share price growth.
Looking at dividends paid is not enough. Often, a company will declare increasing dividends every year. However, when expressed as a percentage growth rate, we can notice if there was a decline in the rate of increase. This decline mostly happens when the share underperforms.
Thus, sustainable top performing companies have:
High dividend and earnings growth rates
Large market capitalisation larger than $10b
Exponential growth of dividends and earnings
Lowest tradability of issued shares
For example, the graph shows dividends increased year on year, from year 2010 to 2019. There were two years when it was the same.
However, when we calculated the year-on-year dividend growth rate, we noticed 2011, 2012, 2015, 2016, 2018 and 2019 was lower than their previous year (coloured red).
When we plot the trend on the graph, we noticed that a strong price growth happens after a lower than before dividend growth rate.
We can use these characteristics to identify when to exit or when to buy back a share. In this example, we needed to trade only 4 times over the 13 years, i.e buy 2012/3, sell 2014/5, buy 2016/7, sell 2017/2018, buy 2020/21
We need to add a check for consistent dividend growth rate over 5 years, but less than 10 years. These front runners often are getting overpriced and soon run out of steam.
Those shares then fall into another category, where we seek companies with the highest compound annual dividend and earnings growth rates over a minimum of ten years, combined with the lowest tradability of issued shares.
By using dividend growth rates, there is a link between balance sheet fundamentals and price performance.
As corporate profits slow down, so does the dividend growth. A decline in dividend growth or an erratic move in dividend growth is then a sure sign of profits slowing down.

