Exchange Traded Funds
Being a passive investor comes at a performance cost. If 80% of managed funds do not beat the index, how can we do better than that?
What is an ETF:
An exchange-traded fund (ETF) is a basket of securities that trades on an exchange just like a stock. ETF share prices fluctuate throughout the trading day; this is different from mutual funds, which only trade once a day after the market closes.
Which EFT to select and how to do research?
The Australian share market is broken up into 11 Sectors, 24 Industry Groups, 68 Industries and 157 Sub-Industries. The ASX has no companies in 9 Sub-Industries
Look at the complete list of ETFs available (Tool: MarketIndex; Tradingeconomics)
As we don't have a crystal ball, look at the following:
1. Economic indicators & forecasts
2. Market Indicators
3. Sector indicators
4. Industries performances
5. What does the financial/economic news say? Is the same message been advocated?
Economic forecast
Spend 10-15 minutes on this to get a general overview and feeling for local and international economics. Be careful of paralysis by analysis. Instead, look for the common denominators. (Tool: TradingView & see list of website URLs below)
Research Approach
Select EFTs that are not too broad. Narrow it down, but that will increase the risk.
Look at the economic indicators' performances which provide insight into what the future may hold – but offer no guarantees. However, it is better than guessing.
a. Get a picture of the trend and following 6 month's forecasts: GDP, business confidence, interest rates, balance of trade, unemployment figures, stock market
b. Look at market indicators and forecasts
c. Look at the stock market and forecasts
d. Look at the overall ASX sectors for the past 1 year
e. Identify the industries that show future growth – note offers no guarantee it will keep on growing
Example
f. For example the industries may be: Energy, Metals (Lithium and gold), coal, rare metals, utilities
g. For confirmation, look at the economic forecasts for resource and energy quarterly report
For example, the forecast shows that iron ore exports will decline, and base metal prices will increase.
h. Check if and how it corresponds to the high-performing shares in the ASX 100, 200, 300
Sometimes the highest growing share may be small caps.
Ignore those
i. Confirm the industries selected against the high-performing shares
j. Look for local ETFs that cover those sectors and/or industries – for clarity fill in a template
Make the Table headings: Sector/Industries; ETF; ETF-Managed Funds; ASX Index
k. There may be no ETFs available that track some local sectors, e.g. Energy, Utilities
l. Identify the underlying index for each of the ETFs
m. Compare the ETF and ASX resources index, e.g. QRE and XJR ASX 200 Resources
They should be very similar
n. Update the ETF template for the information on the selected ETF
o. Sometimes you may get multiple ETFs for the same industry, e.g. QRE and OZR for the resources industry
p. While the ETFs are similar, look at their Top 10 holdings
q. Identify any concerns in their holdings, e.g. QRE has BHP 38% loaded.
r. For example, from our previous economic forecasting research, we noted that iron ore price growth will decline
s. Look at the one and five-year performance
t. Evaluate the Fourier analysis, long-term price growth, long-term significant cycle trend, velocity, Mass
u. Do a 50 and 100 days moving average
v. Do the GMMA analysis and RSI indicator
w. Look at what other market commentators say
x. What is the conclusion?
Select the next industry that was identified in point (f) and confirmed in (i)
Repeat the steps from (k) to (x) for each ETF identified
Do a maximum of three ETFs
Update the ETF template
Some sectors (e.g. energy) may have an index but may not have a directly associated ETF.
a. Look at the top-performing shares in the sector (e.g. energy)
b. Investigate and ensure that the high performance was not due to penny stocks. (e.g. Energy sector-top performance was because of many penny stocks)
c. If so, then select the most significant market capitalisation shares in the sector that also performed the best
d. You may see a few that didn't do well.
e. Identify the industries from which those large-cap stocks are, e.g. Santos, Woodside, BHP
f. Check which ETF covers both resources and energy. Look at the top-performing shares in that ETF and see if they cover mainly those you are interested in from the energy sector
g. This may be a mixed bag, as there may be a few lemons among them (e.g. BHP, because the forecast showed that iron ore exports will decline)
h. If you selected the ETF, then update the Table
If there are too many lemons in the mix, select a different sector.
Keep the research information for when we need to select a few individual shares.
From the other sectors identified (e.g. metals), continue the search for the following ETF.
Select between similar ETFs
Often, there may be more than one ETF for the same sector.
They may be similar, but not always exactly the same.
To pick one:
a. Comparing the asset value under management, performance, top 10 holdings and fees
b. Compare the ETF to the ASX Energy sector index. Note how they differ slightly
Compare the resources ETF QRE and ASX resources index.
c. Update the ETF template for QRE
d. Note that QRE and OZR are similar ETFs for the resources industry. Look at their Top 10 holdings
QRE has BHP loaded at 38%. This is a concern as iron ore prices decline, as indicated by economic forecasting resources.
e. OZR is the same with the exact fees as QRE
Check the ETFs against their ASX index.
As the ETF tracks the underlying index, they are very similar.
But for the same sectors, if one tracks the underlying ASX 200 and the other tracks the underlying ASX 300 index, they will differ slightly.
This is because the latter will have a wider spread, lower risk, less growth and more dilution.
Note, as mentioned, there is no ETF for the Australian energy sector. That implies we must look at individual industries and shares for that sector.
Instead, look at subsets of industries within that sector by checking the top 10 shares with each index.
Special Tools
The tools used have been listed under <TAB> TOOLS
The following tools discovered may be of interest:
ETFCompare developed by Marco Simic
ETFTracker developed by Mark Monfort
Special benchmarking
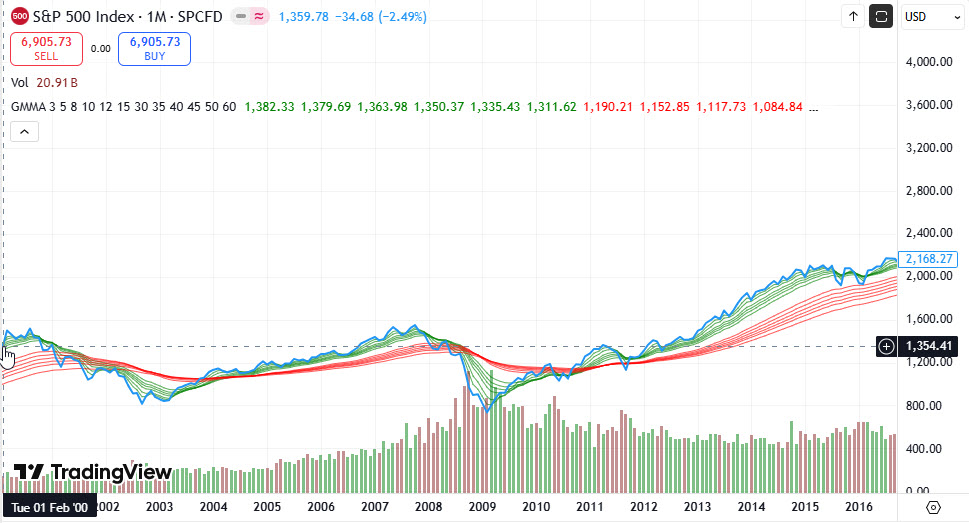
In the book "Blue Print to Wealth" by Gary Stone, they ran a comparison test, showing the composition and performance of USA-managed funds. Starting with $100k capital, they performed the testing between 2/2001 and 6/2016. Below, you can see the SP500. He then continued to introduce ETFs and shares as a combination of investments. While it's written for the USA market, the concepts given are sound for any market.
His research showed that the most straightforward, productive and efficient long-term strategy for time-poor investors is to invest in index ETFs or index-managed funds.
He introduced the core and satellite concepts. The core portion is typically passively managed, such as index ETFs, passive index managed funds and individual large-cap stocks that usually pay good dividends. (See Table)
The satellite includes actively managed stocks, funds, rotating sector ETFs, international index ETFs, and other higher-risk assets. He also introduces "timing the market" as a core risk management technique rather than diversification into lesser-performing asset classes.
The 3x ETFs and 2x stocks provided slightly less performance than ten equally-weighted stocks. This is because the ten stocks give less diversification and much higher risk. However, the performance difference is minimal. To get the best performance, you needed to perform several trades over the 15 years.
Dollar-Cost Averaging
Dollar-cost averaging (DCA) is the practice of investing a fixed dollar amount on a regular basis, regardless of the share price.
Dollar-Cost Averaging improvement
Can we improve dollar-cost averaging?
Let check the results if we change the rules for DCA slightly:
Case 1: Use DCA across the entire period on a monthly basis (general rule)
Case 2: Use DCA across the entire period on a monthly basis EXCEPT when the market turns down, we don’t invest
Case 3: Same as Case 2 but instead, we accumulate the investment funds as soon as the market declines but don’t invest in any shares. We time when the market will increase and then buy in three tranches using the accumulated funds plus following the usual DCA.
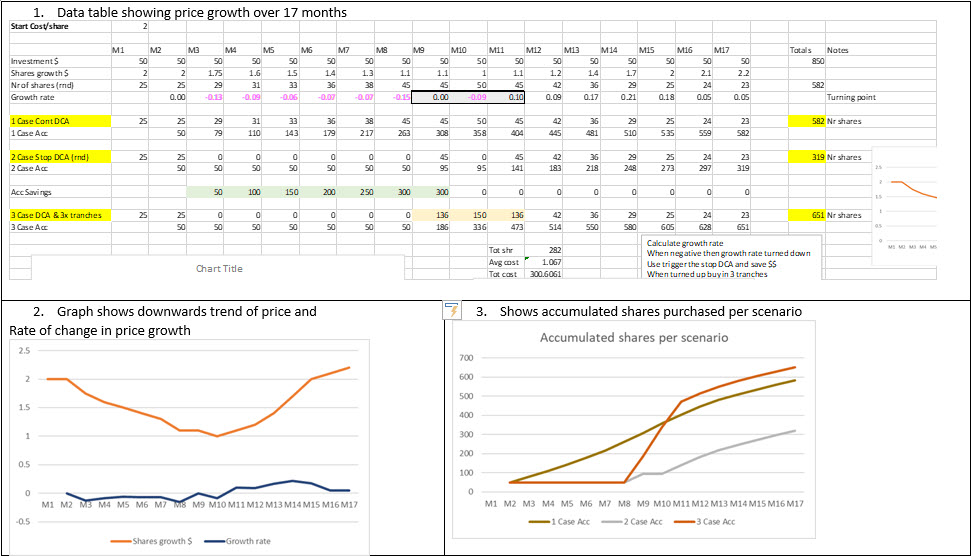
Results: For a specific price growth scenario as per figure 1 below. We calculate the rate of change to determine when the downturn starts and ends (show in Fig 1 block)
Case 1: Bought 582 shares
Case 2: Bought 319 shares
Case 3: Bought 651 shares. This is a 12% improvement on DCA.
Therefore, it’s a combination of DCA and buying the dip.